
Accessing Ocean Current Data
Teaching Objectives
- Identify reliable sources for accessing ocean current observational data and forecast models
- Understand how to obtain and use RTOFS and Mercator current models within routing software
- Learn how to access and interpret altimetry (Sea Surface Height, SSH) data
- Apply ocean current data effectively within routing workflows to improve navigation decisions
There are several sources available for obtaining both observational data and forward-looking models of ocean currents that will be encountered during a voyage.
Within routing software such as Expedition, it is straightforward to download modeled current predictions using systems such as RTOFS and Mercator. These models provide forecast currents over the duration of a passage and can be directly incorporated into routing calculations.
In addition, RTOFS provides access to observational Sea Surface Temperature (SST) data, which can be overlaid onto charts. This allows direct comparison between observed ocean structure and modeled current predictions—an important step in validating routing decisions.
Accessing altimetry data—specifically Sea Surface Height (SSH) and derived current estimates—is less obvious and is outlined below.
Accessing Altimetry (SSH) Data via NOAA ERDDAP
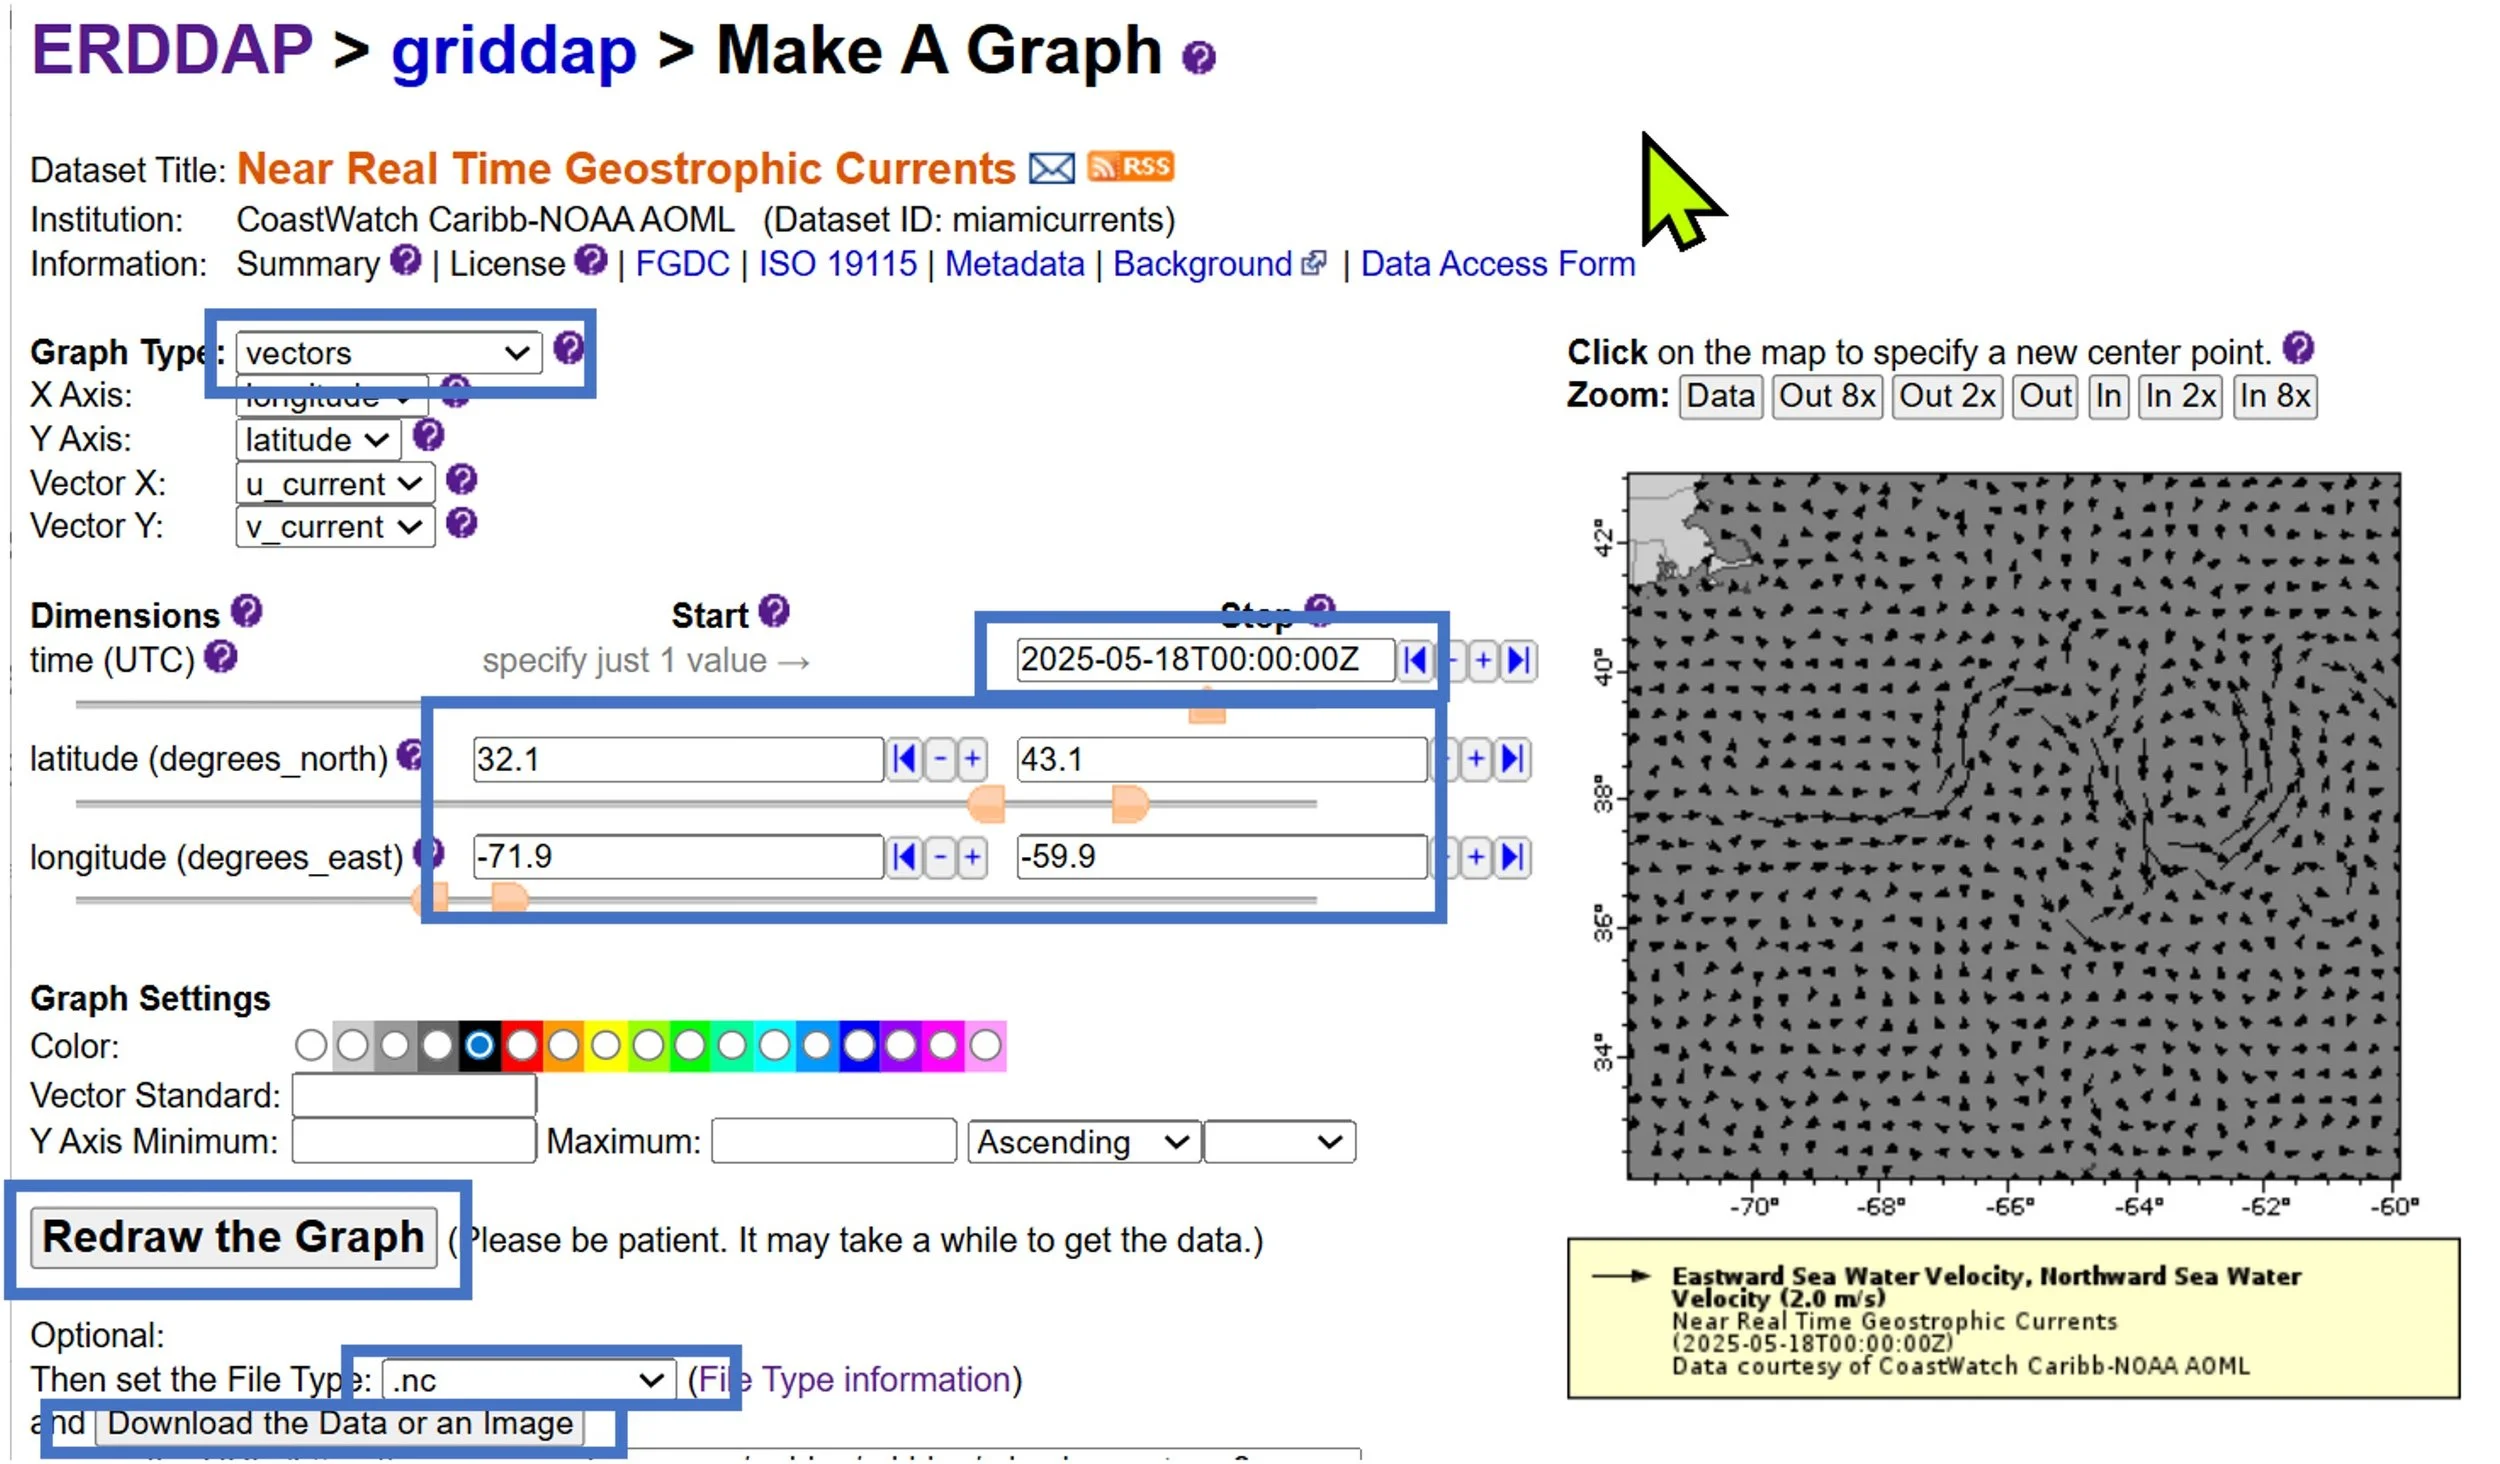
To obtain ocean current estimates derived from altimetry data, follow these steps using the NOAA ERDDAP site:
2) Select the desired date (Note: selecting today’s date will return the most recent available data, which may be delayed by 1–3 days)
3) Enter latitude and longitude values for your region of interest
4) Click “Redraw Graph”
5) Set the file type to “.nc”
6) Click “Download data or an image”
This process generates a GRIB-compatible file of ocean currents derived from SSH data. This file can then be imported into routing software such as Expedition and used alongside forecast models to improve navigation strategy.
Application to Routing
When visualized along the rhumb line from Newport to Bermuda, these datasets often reveal key features such as the Gulf Stream crossing and associated eddies.
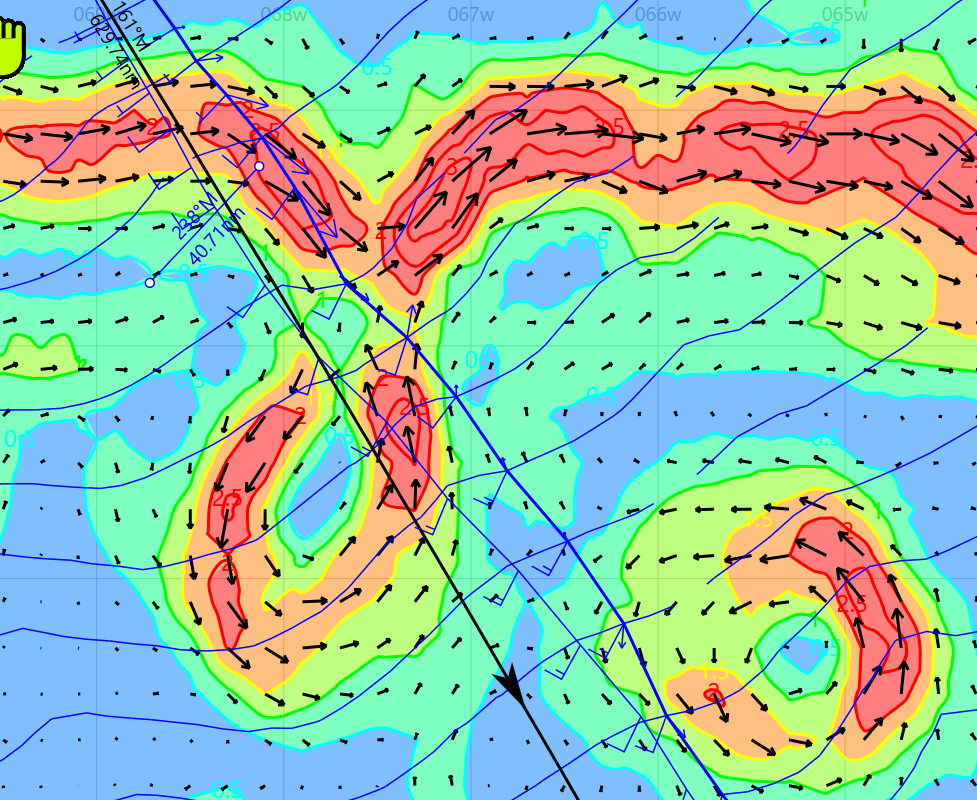
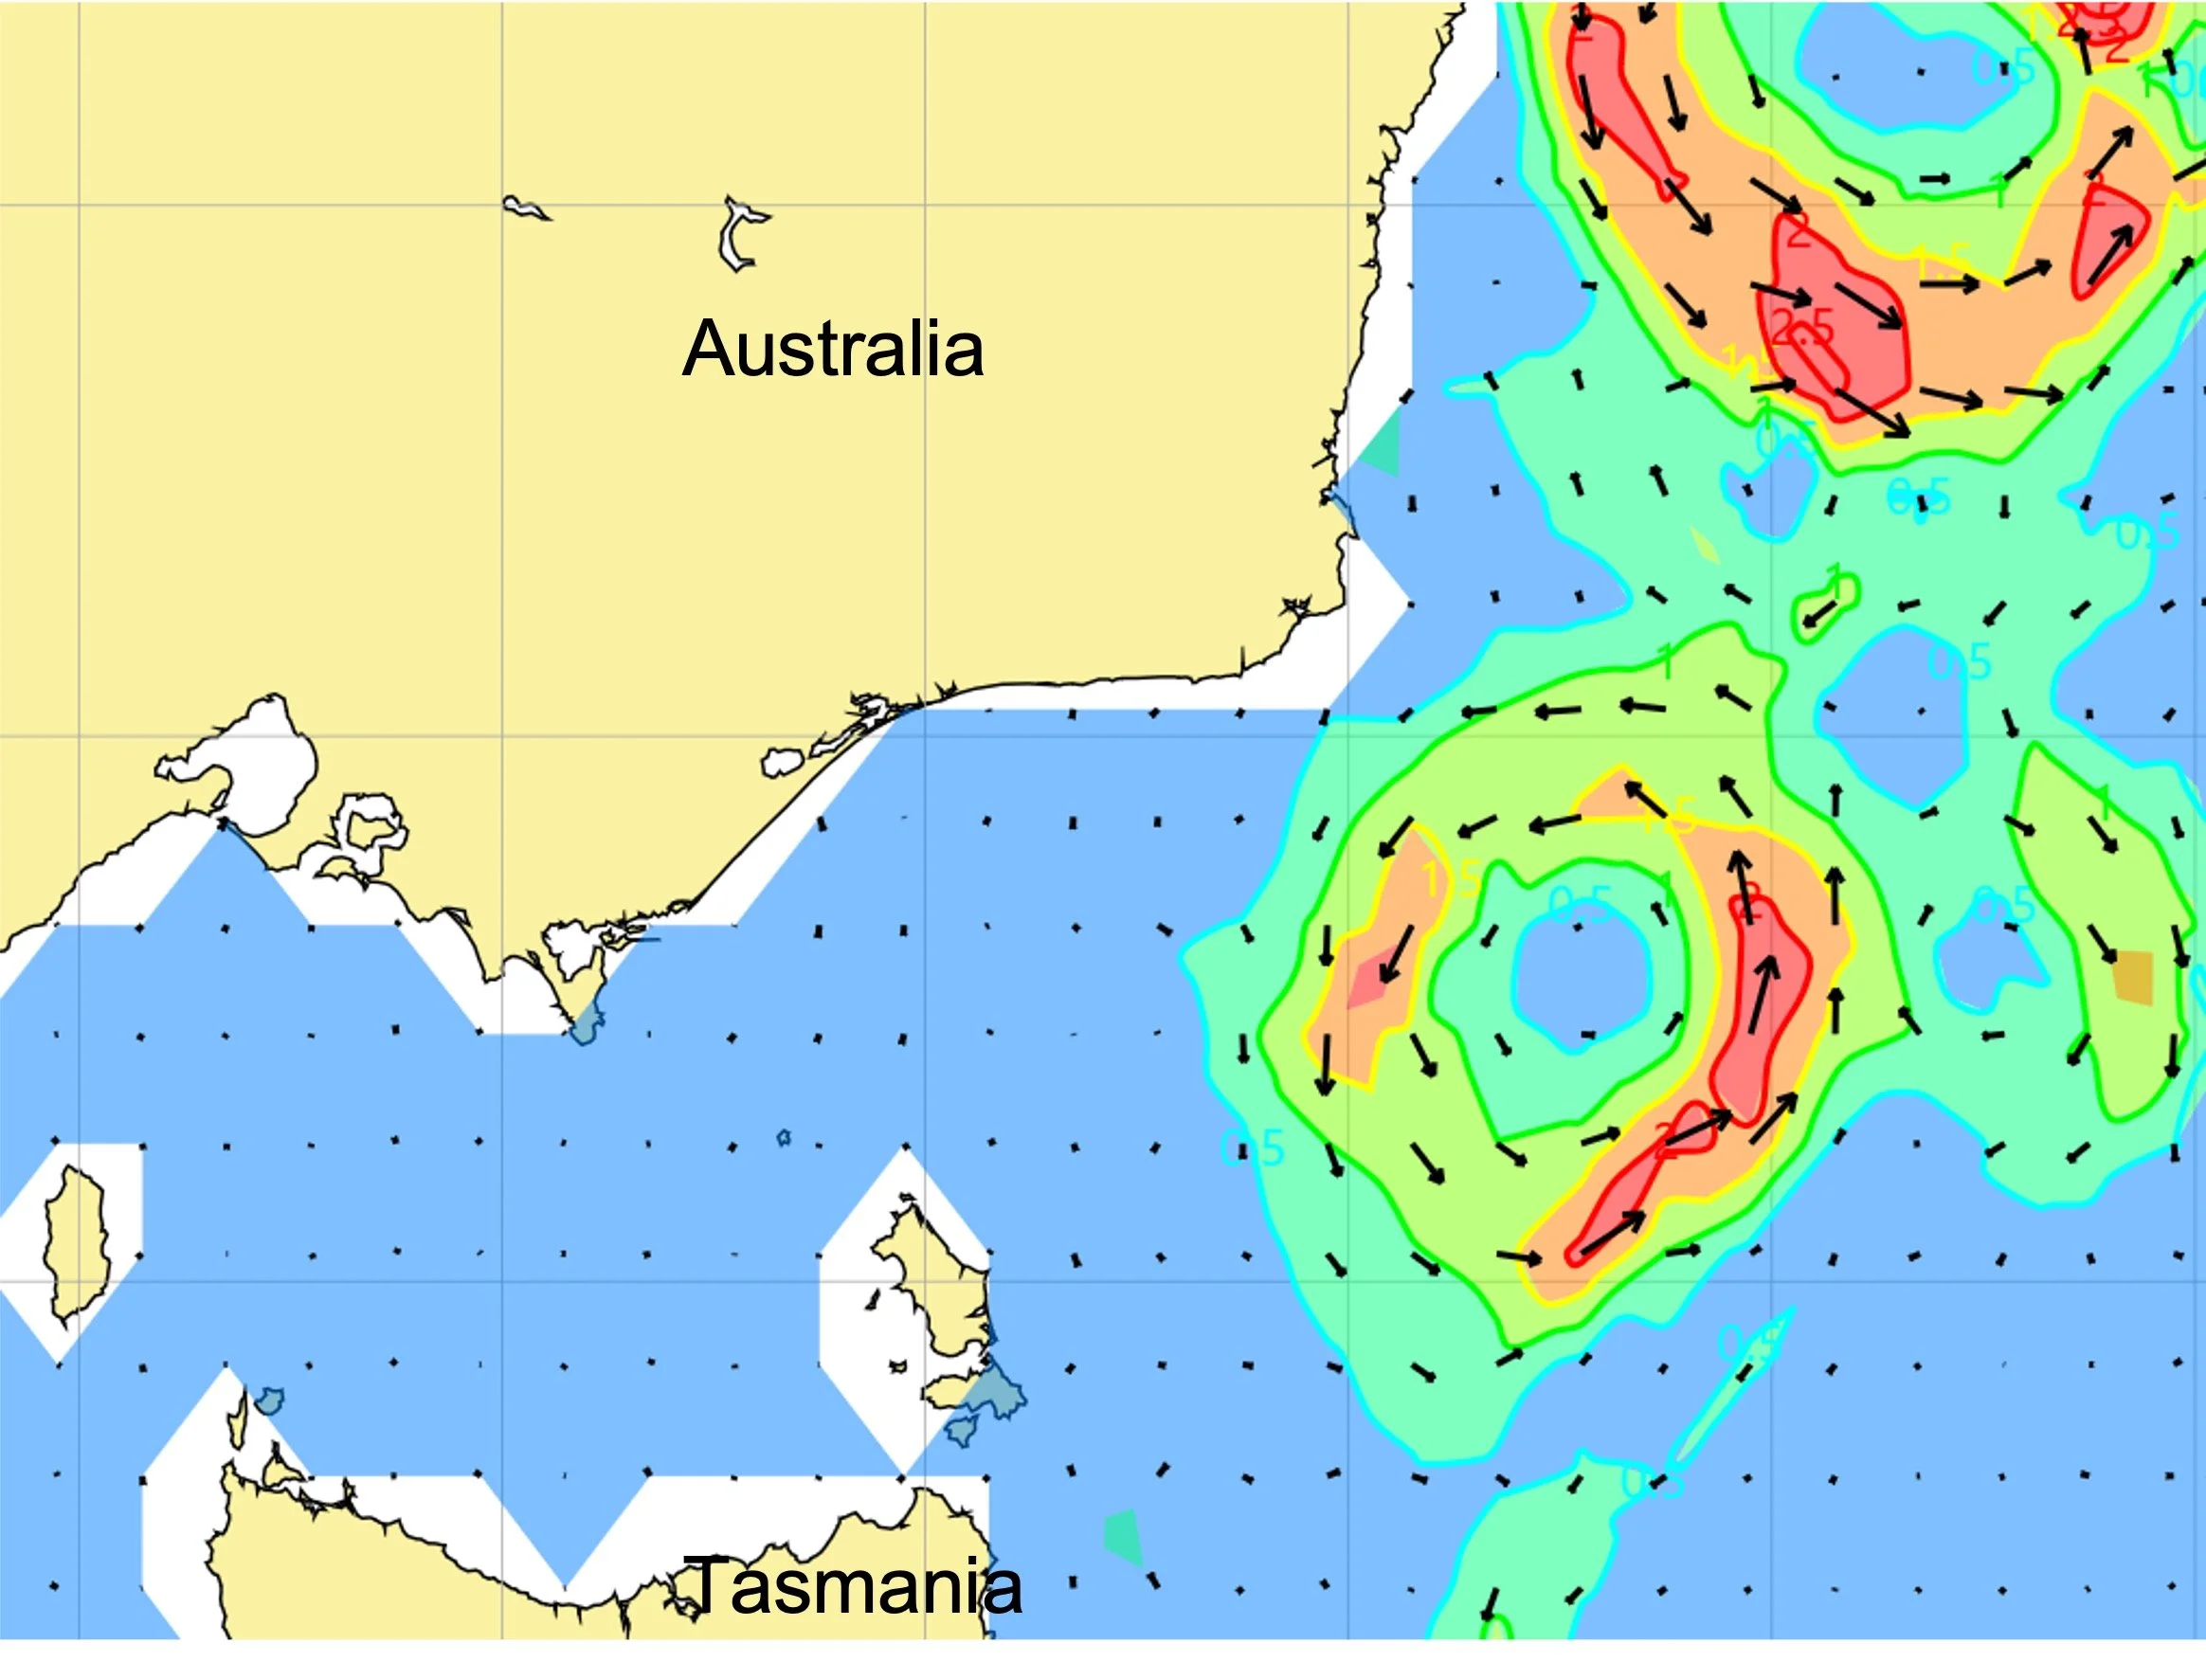
For example, an eddy positioned directly on the rhumb line can significantly influence routing decisions. Identifying such features in advance allows the navigator to either exploit favorable currents or avoid adverse ones. Similarly, eddies are frequently encountered in the Sydney Hobart race and are a key navigation element of this race.
Sailor Takeaways
- Use both forecast models (RTOFS, Mercator) and observational data (SST, SSH) for routing
- Always validate model output against real-world observations when possible
- SSH (altimetry) is especially valuable for identifying eddies that models may miss
- Expect a 1–3 day delay in observational datasets—plan accordingly
- Integrate all data sources into routing software for the most informed decision-making